
California has over 35 million registered motor vehicles traveling over 315 trillion miles across the state - but where these miles are traveled are not uniform across the state.
Higher traffic volumes contribute to air pollution as well as other environmental and public health outcomes, such as increased noise and light pollution, as well as a greater risk of traffic collisions with pedestrians, bicyclists, and other vehicles.
These negative outcomes of high traffic volumes have been shown to disproportionately impact non-white and low-income communities.
Understanding where high traffic volumes are present across the state is important to address these negative outcomes.
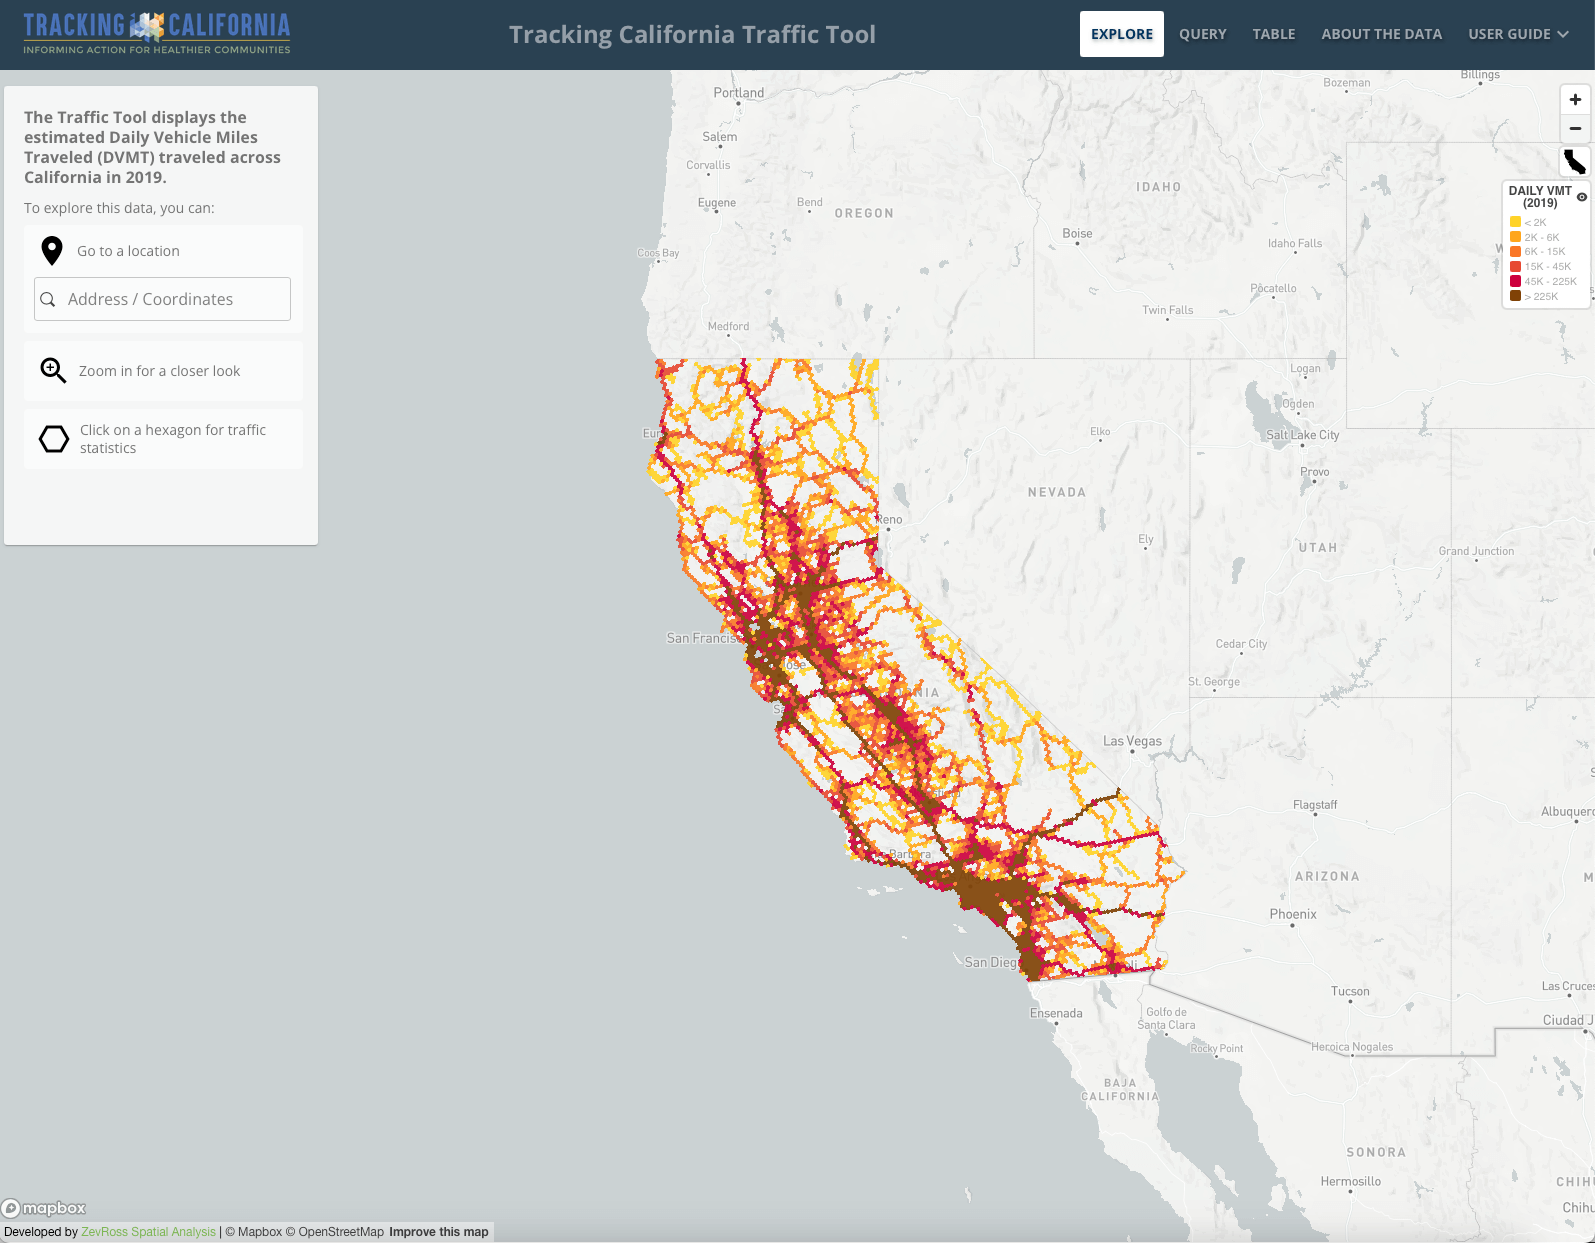
Tracking California's Traffic Tool enables users to explore and query traffic data, aggregated at various geographic scales to show general patterns across the state.
Users can also query specific locations by entering an address and setting a distance around this location. Users are provided with:
- A Daily Vehicle Miles Traveled (DVMT) total that describes the mileage traveled by all vehicles in that area on an average day.
- Annual Average Daily Traffic (AADT) statistics that describes the characteristics of traffic in that area on an average day for that year.
The Traffic Tool was released in 2024, using open traffic volume data from 2019. In addition to the Traffic Tool hosted on the website, Tracking California can provide large-scale query processing and aggregated datasets at request that can be used for traffic impact analysis.
Traffic Across California
Explore traffic volume trends across the state using Tracking California's Traffic Tool.
Traffic and Human Health
The presence of traffic, particularly high traffic volumes, can have significant impacts on human health, with traffic collisions and traffic-related pollution creating acute and chronic health issues.
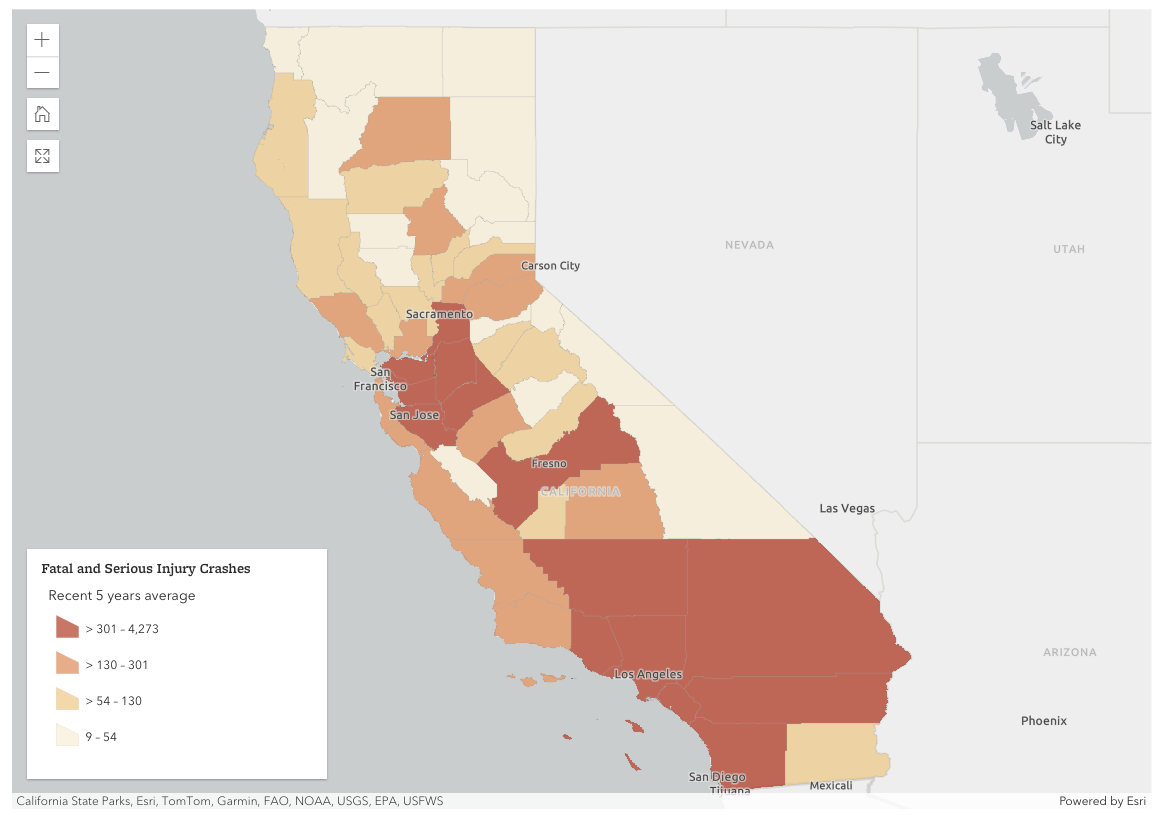
Traffic Collisions
Traffic collisions - whether between one or multiple vehicles or involve other road users, such as pedestrians and bicyclists - can result in serious injury or death.
In 2020, nearly 4,000 people were killed on California’s roads; pedestrians represented over 25% of these deaths, and 153 bicyclists were also killed. The number of deaths on California’s roads has increased by 22% between 2019 and 2022, with the number of pedestrian and bicyclist deaths increasing by 19%.
Speeding and improper turning (especially left turns) are commonly cited causes of vehicles crashes. The economic and quality-of-life costs from vehicle crashes in California total over $166 billion dollars each year.
Most collisions occur in urban areas and on non-state highways, i.e., arterial and local roads. Pedestrians and bicyclists are particularly vulnerable in any vehicle collision.
Traffic-Related Pollution
High traffic volumes contribute to three key sources of pollution in our environment that can have impacts on human health: traffic-related air pollution (TRAP), noise pollution, and ground pollution.
1) Air Pollution
Cars, trucks, and other vehicles account for over 35% of California’s total climate-changing emissions, higher than any other emission sector. Vehicles contribute to these emissions through both tailpipe and non-tailpipe abrasive vehicular wear.
Key air pollutants from traffic include:
• Nitrogen oxides: Road transportation accounts for 34% of nitrogen oxides (NOx) emitted statewide. NOx is a precursor to ozone, a toxic gas we recognize as ‘smog’, that is prevalent throughout California and harms respiratory health.
• Particulate Matter: Road transportation accounts for about 8% of fine particulate matter (PM2.5) emissions statewide. PM2.5 is a complex mix of chemicals that can be breathed deeply into the lungs and has been associated with respiratory disease, cardiovascular health, cancer, and premature birth. It is estimated that PM 2.5 contributes to 1,400 premature deaths due to cardiopulmonary causes each year in California.
• Carbon Monoxide: Road transportation accounts for nearly 30% of carbon monoxide (CO) emissions statewide, and it can account for over 90% of CO emissions in urban areas. CO can reduce the body’s ability to transport oxygen and interfere with healthy organ functions and increase risks of poor birth outcomes.
2) Noise Pollution
The main contributors to community noise are transportation-related, including road traffic, trains, and airports. Living with traffic noise has been associated with annoyance, stress, and sleep disturbances, as well as linked to many negative long-term health impacts. Studies have shown that constant traffic noise results in an 8% risk of cardiovascular disease, a 6% risk of diabetes, and reduced life expectancy. Living close to a busy highway can have a significant impact on a person's physical and mental health.
3) Ground Pollution
Vehicle use also contributes to pollution that infiltrates into soils and can be washed into water systems during rainstorms and snowmelt. Road dust, heavy metals, polycyclic aromatic hydrocarbons (PAHs), and salts are all common types of ground pollution associated with vehicle use. Vehicle wear, such as the wearing of breaking systems, tires, and clutch plates, is one of the chief sources of heavy metal deposits in the urban environment.
Heavy metals can be toxic at low levels of exposure, and metals, such as nickel, cadmium, and chromium, are carcinogenic to humans. Road dust can also change the properties of nearby soil and plants, and the aquatic environment is even more susceptible to the harmful effects of heavy metals.
Who is Vulnerable to the Impacts of Traffic?
Traffic Collisions
Road systems in communities of color are more dangerous because of systemic racial bias in transportation infrastructure policy and implementation. This stems from a history of busier roadways built and developed in these communities, underinvestment in transit and pedestrian infrastructure (such as segregated bicycle lanes and sidewalks), lower implementation of traffic calming measures and traffic reduction measures (such as Low Emission Zones and Slow Streets), disproportionate traffic stops, and bias in driver interactions with pedestrians.
Fatal traffic collisions involving pedestrians and bicyclists disproportionately affect Black, Native/Indigenous and Hispanic populations and lower-income communities across the state. Fatalities per mile traveled are higher for Black and Hispanic populations across all modes of travel, including driving, walking, and bicycling.
Fatal and serious crashes are often clustered around “high injury corridors”, which are segments of roadway that experience high levels of crashes. Common features of these high injury corridors include a limited number of safe pedestrian crossings, wide roadways, vehicle-oriented infrastructure, and high and/or fast traffic volumes. These high injury corridors are more likely in communities of color.
Compared to urban areas, rural areas have a higher fatality rate (measured as fatalities per vehicle mile traveled). This may be because of multiple overlapping factors, including road infrastructure (e.g., undivided highways, lack of lighting); driver behaviors (e.g., driving after alcohol use due to a lack of public transportation); demographics (e.g., older drivers); and/or other community characteristics (e.g., access to emergency healthcare facilities).
Traffic-Related Pollution
1) Air Pollution
The distribution of traffic-related air pollution (TRAP) – and resulting health impacts – is not equitable across California’s communities. On average, Black, Latino, and Asian Californians are exposed to more PM2.5 pollution from cars, trucks, and buses than white Californians. These groups are exposed to PM2.5 pollution 43, 39, and 21 percent higher, respectively, than white Californians. On-road emissions are a large driver of overall racial disparities in PM2.5 exposure, and racial disparities in transportation pollutants persist regardless of income.
Furthermore, exposure to PM2.5 from cars, trucks, and buses is not equally distributed across the state. People living in Los Angeles County are exposed to 60 percent more vehicle pollution than the state average and 250 percent more than the San Francisco Bay Area. Additionally, Californians living in households without a personal vehicle are also exposed to much higher levels of vehicle pollution than other households because they tend to live in urban areas surrounded by vehicle traffic.
2) Noise Pollution
Traffic noise does not affect everyone equally. Across the United States, daytime and nighttime noise levels were found to be higher in low-income communities and those with a large proportion of non-white residents. These non-white communities and lower-income communities often live in areas near highways and airports in poorly insulated homes.
Other Traffic Resources
OEHHA CalEnviroScreen Traffic Impacts Indicator
California's Office of Environmental Health Hazard Assessment (OEHHA) creates and publishes its own statewide Traffic Impacts Indicator on its CalEnviroScreen platform (for 2017). The indicator assigns each census tract within the state with a traffic percentile, i.e., for each census tract, how does its traffic volume and density compare to other census tracts across the state.
CalTrans Traffic Census Program
CalTrans collects raw traffic counts across the state each year as part of its Traffic Census program. It collects counts for the State Highway System only (i.e., interstates, freeways, expressways, and principal arterial roads) through electronic recorders. CalTrans provides data for All Vehicles and a separate dataset for Trucks only for download online.
CHP's SWITRS
Collision data is collected by California's Highway Patrol (CHP) and stored within the Statewide Integrated Traffic Records System (SWITRS). The system is a database that collects and processes data gathered from a collision scene and can be used to create statistical reports on collisions within the state using an application interface.
UCB's TIMS at SafeTREC
University of California, Berkeley's Transportation Injury Mapping System (TIMS) has been developed over the past ten-plus years by the Safe Transportation Research and Education Center (SafeTREC) to provide quick, easy and free access to California crash data from SWITRS, including geo-coded data to map crashes.