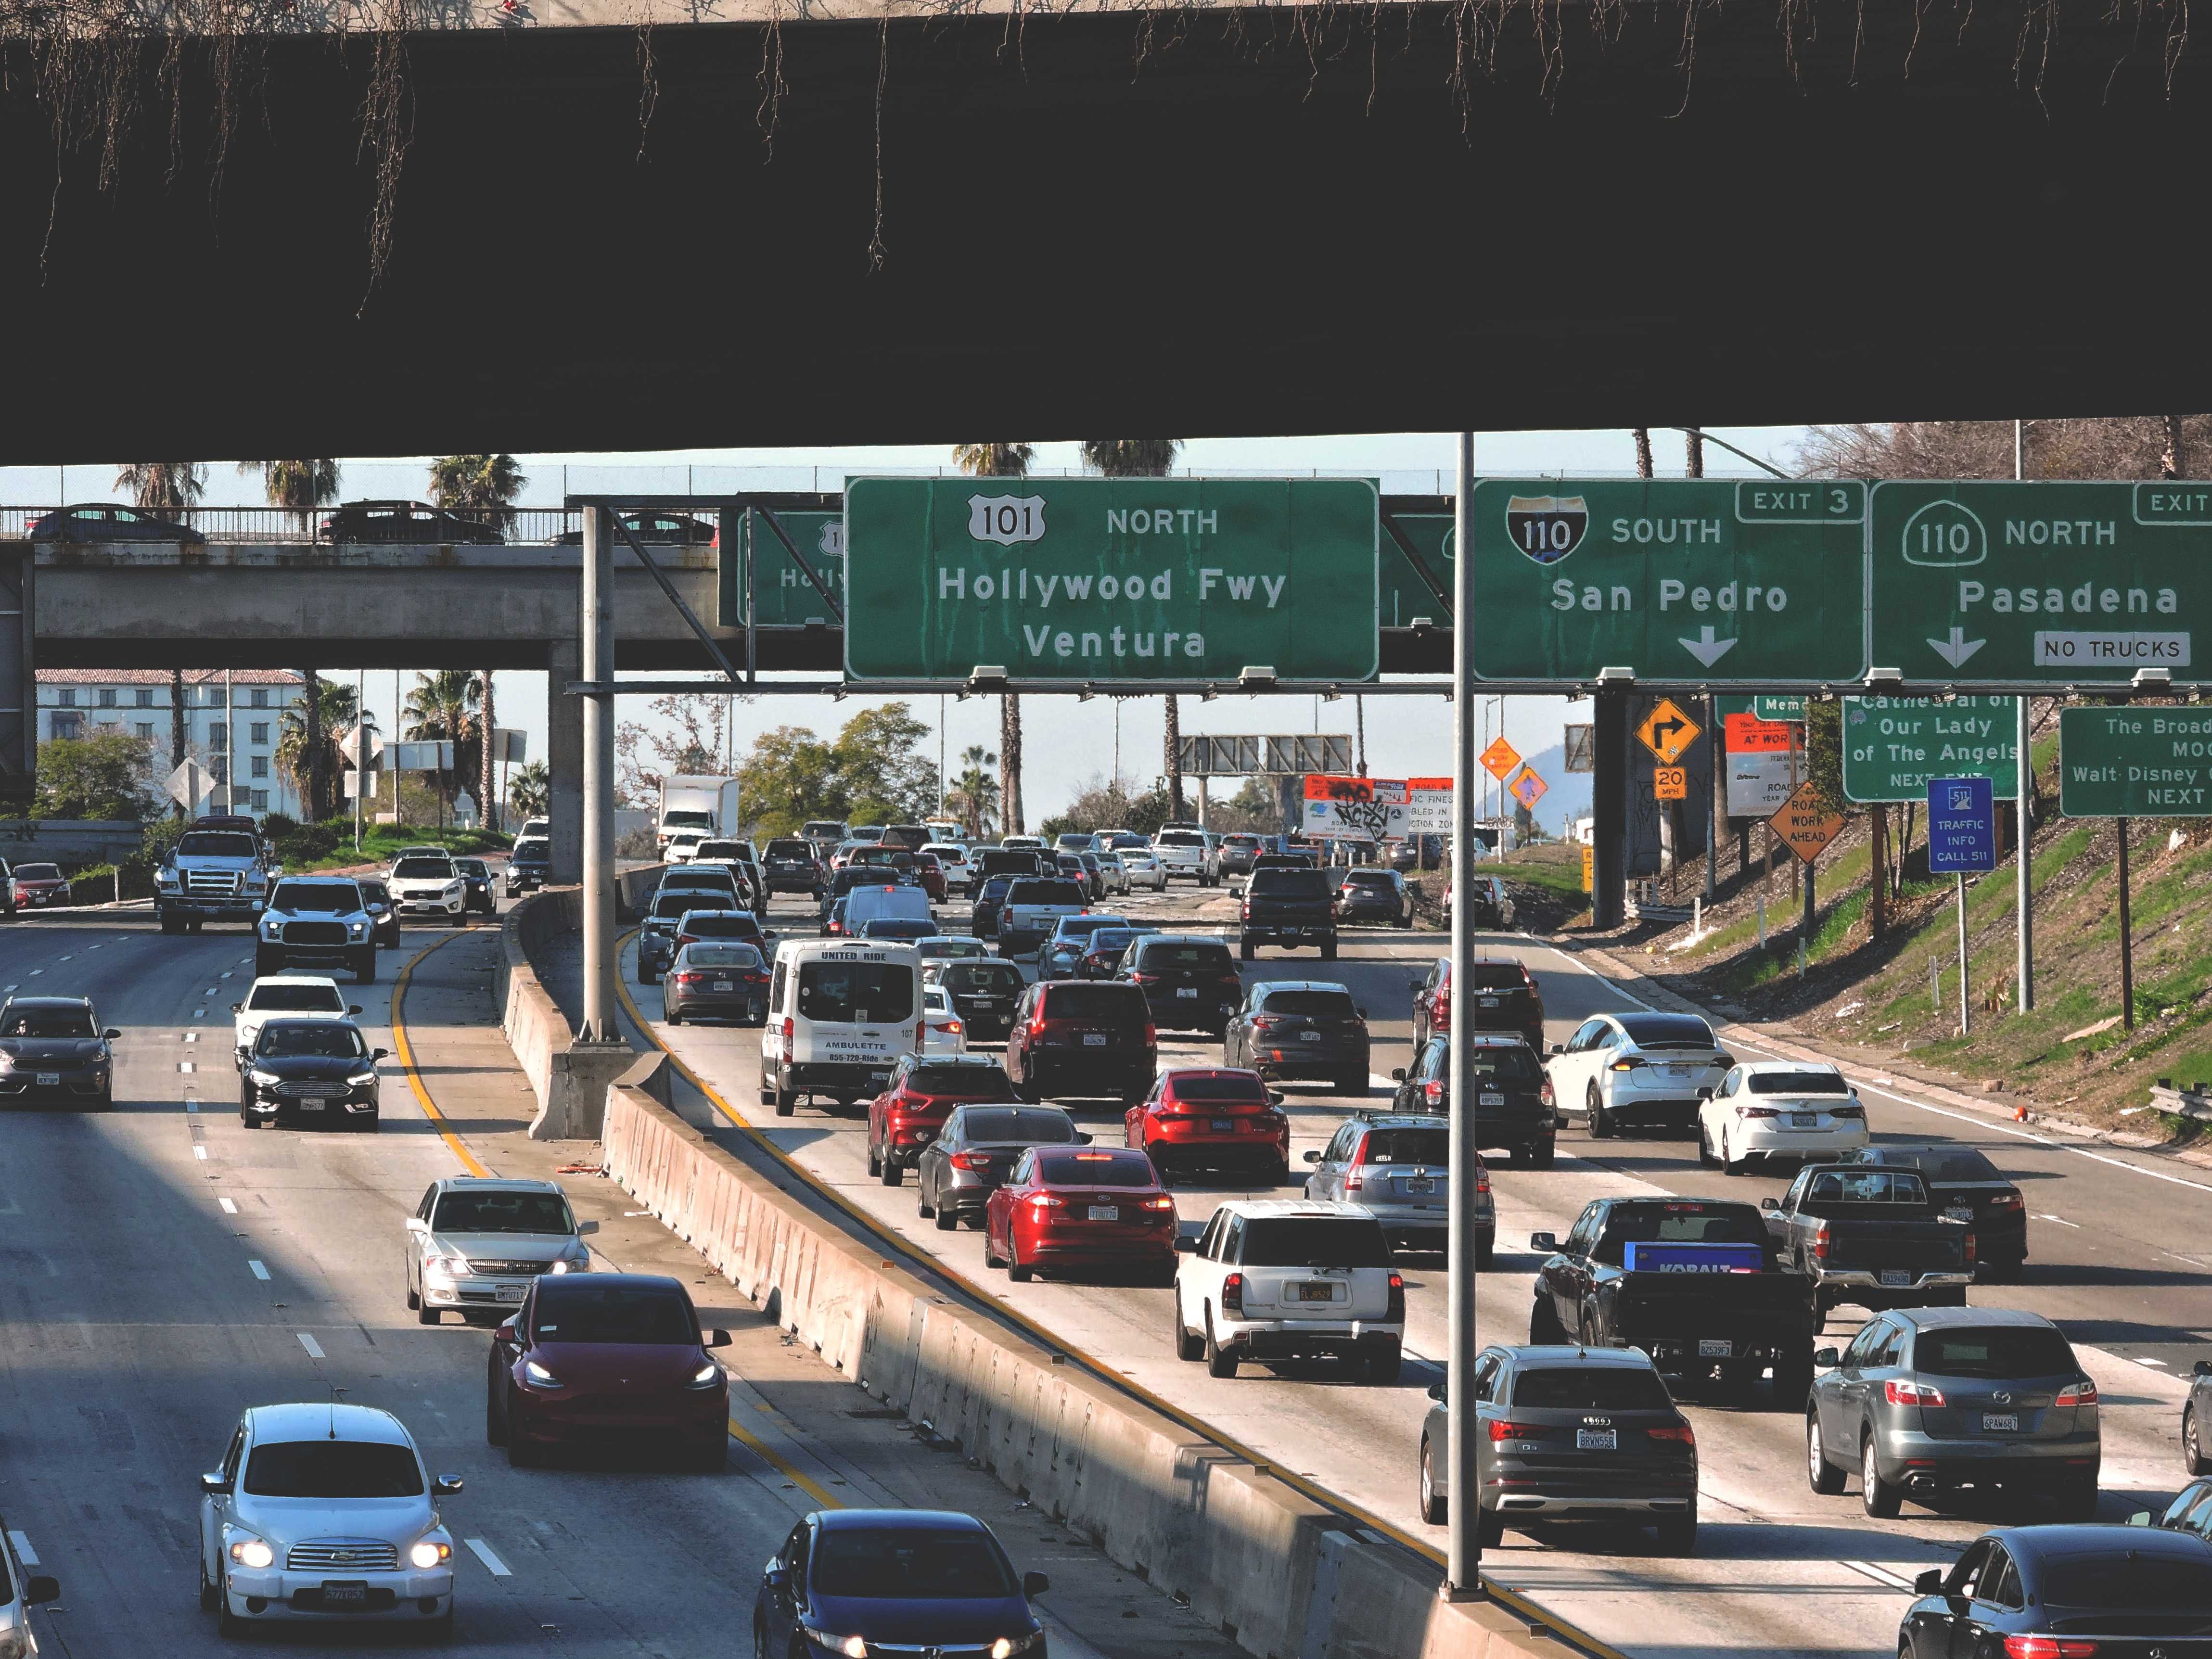
California has over 31 million registered motor vehicles travelling over 32,000 million miles across the state - but where these vehicles are and where these miles are travelled are not the uniform across the state.
Nearly half of all annual vehicle miles travelled occured on Interstates, Freeways, and Expressways, whilst Los Angeles County alone accounts for 23% of the state's annual mileage.
Higher traffic volumes contribute to traffic pollution as well as other environmental and public health outcomes, such as increased noise and light pollution, as well as a greater risk of traffic collisions with pedestrians, bicyclists, and other vehicles.
These negative outcomes of high traffic volumes have been shown to disproprotionately impact non-white and low-income communities.
Understanding where high traffic volumes are present across the state is critical to be able to address these negative outcomes. There is, as a result, a need for data that details traffic volumes at a fine resolution across the state.
Traffic Volume Data and Tools
Tracking California's Traffic Tool
Tracking California provides the Traffic Tool that enables users to query traffic volumes across the state at the local scale. Using the tool, users can explore the 2019 traffic dataset, aggregated at various scales to show general patterns across the state.
Users can then query specific locations by entering an address and setting a distance around the location. Users are provided with a Daily Vehicle Miles Traveled (DVMT) total to describe the amount of traffic in their area and Annual Average Daily Traffic (AADT) count statistics that describes the general pattern of traffic.

The Traffic Tool was released in 2024, using open traffic volume data from 2019. The tool provides a long awaited update on its predecessor that was first released in 2008 and retired in 2017. In addition to the Traffic Tool hosted on the website, Tracking California can provide large-scale query processing and aggregated datasets at request.
OEHHA CalEnviroScreen Traffic Impacts Indicator
California's Office of Environmental Health Hazard Assessment (OEHHA) creates and publishes its own statewide Traffic Impacts Indicator on its CalEnviroScreen platform. The indicator assigns each census tract within the state with a traffic percentile, i.e., for each census tract, how does its traffic volume and density compare to other census tracts across the state. Documentation on their Traffic Indicator can be found on their website. The current indicator reflects traffic impacts for 2017.
External Resources
CalTrans Traffic Census Program
CalTrans collects raw traffic counts across the state each year as part of its Traffic Census program. It collects counts for the State Highway System only (i.e., interstates, freeways, expressways, and principal arterial roads) through electronic recorders. The program releases an updated spatial dataset each year, available through its GIS Data Library and provides yearly data as spreadsheets on its website. CalTrans provides data for All Vehicles and a separate dataset for Trucks only. The most recent year available in 2022.
